The Verdict
The moment of truth. We’ve mapped every bar in the city, filtered 174 million taxi records down to 88.6 million usable rides, and built a custom spatial model to assign each ride a drinkiness score based on time and location. All in service of one question:
Do drunk people tip taxi drivers better?
But First: What Does Tipping Even Look Like?
Before we compare drunk and sober riders, it’s worth understanding the overall shape of tipping in NYC taxis. These distributions are interesting in their own right.
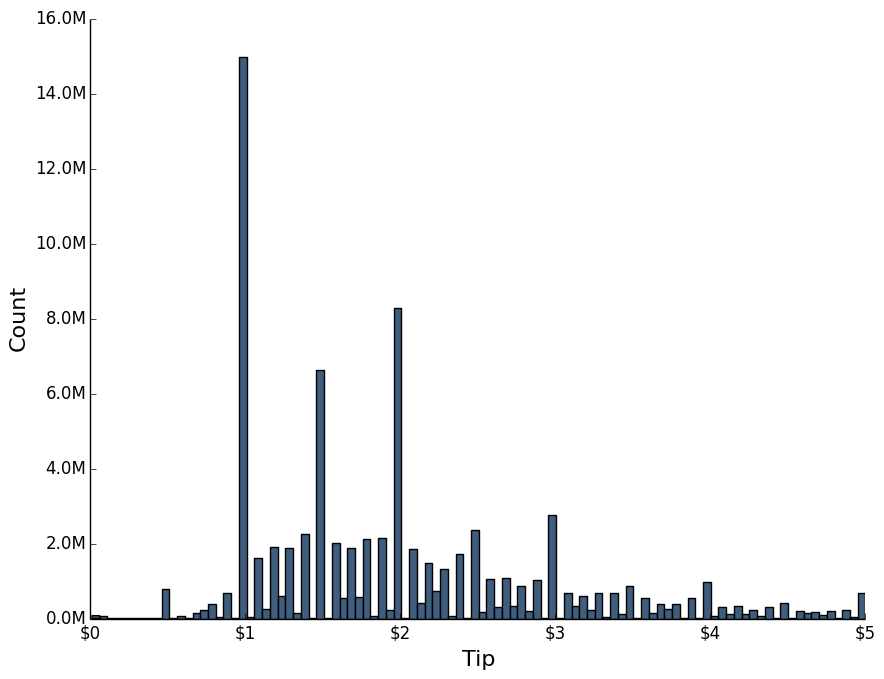
The distribution of tip amounts is striking. There are enormous spikes at exactly $1.00 and $2.00, with smaller peaks at other round numbers. People overwhelmingly tip in whole dollar amounts — the kind of fast mental math you do when signing a receipt in the back of a moving car.
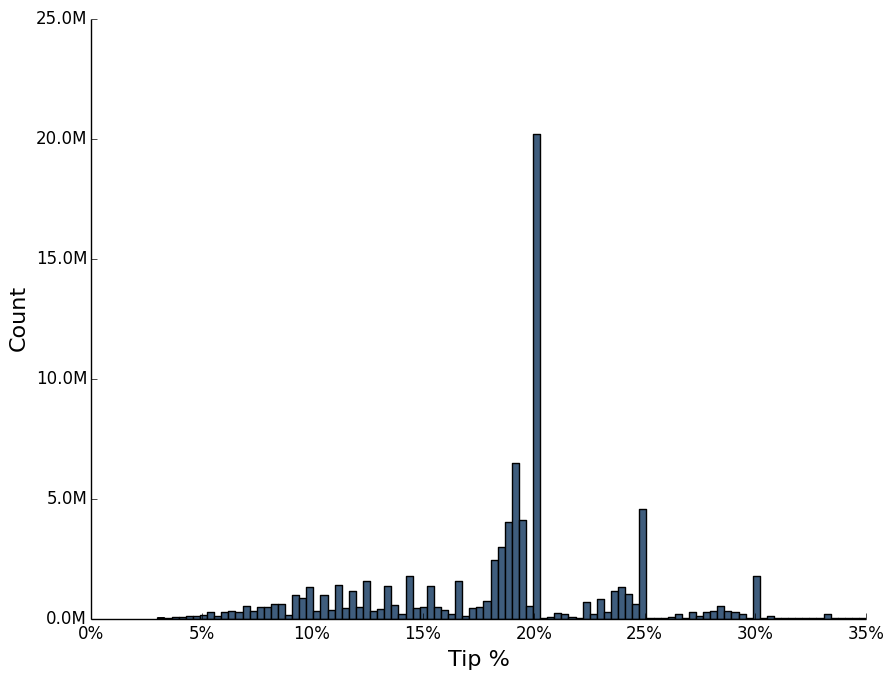
The distribution of tip percentages tells a complementary story. There’s a towering spike at exactly 20%, with secondary peaks at 25% and 30%. These correspond to the preset tip buttons on the credit card terminal. When the machine offers you 20%, 25%, or 30%, most people just press a button rather than entering a custom amount. The credit card machine, it turns out, has an outsized influence on tipping behavior — arguably more than anything else in our model.
The Simple Answer
Let’s start with the bluntest instrument: linear regression of tip percentage against drinkiness score.
R² = 0.02.
That’s… nothing. An R-squared of 0.02 means our drinkiness model explains about 2% of the variation in tipping. For all practical purposes, there is no linear relationship between drinkiness and tipping.
OK, maybe a linear model is too crude. Let’s segment the population into quartiles — the 25% “most drunk” rides versus the 25% “most sober” rides — and compare averages.
The “drunkest” riders tip about 0.06% less than the “most sober” riders.
So the answer to Steve’s question is: no. Drunk people do not tip better. If anything, they tip a hair worse. We could have saved ourselves quite a lot of work by just guessing “probably not” and moving on with our lives.
But.
The Interesting Answer
Averages lie. Or more precisely, they bore. The distribution tells a much more interesting story.

When we look at the full distribution of tip percentages for “drunk” versus “sober” riders, the middle is nearly identical. The two groups tip almost exactly the same most of the time. It’s at the extremes where the differences emerge:
| Behavior | “Drunk” Riders | “Sober” Riders |
|---|---|---|
| Leave no tip at all | 3.10% | 2.61% |
| Leave an exorbitant tip (>30%) | 3.50% | 3.37% |
Drunk people are more likely to leave no tip at all — stiff the driver entirely — and also more likely to leave an exorbitant tip. The typical ride in between? Virtually identical.
In other words: drunk people don’t tip better or worse on average. They tip more extremely. Their distribution has fatter tails. They are, statistically speaking, more chaotic tippers.
After all this work — 174 million records, 11,000 liquor licenses, three interactive maps, a custom street-graph routing engine, k-d trees, a subjective drinkiness model validated by consulting “current and former New York City denizens,” and enough data cleaning to fill a semester — we are awarded with the insight that drunk people may have more extreme views than sober people.
Which, honestly, feels about right.
Epilogue
I asked Steve if he would hail a cab over to have drinks with me, so we could discuss next steps.
He told me he didn’t believe you can get a cab in Los Angeles.
Data Science.
Interactive Maps
The interactive maps from this investigation are still available:
- Bar Coverage Map — liquor license locations as circles, color-coded by type
- Heatmap — weighted liquor license concentration
- Cluster Map — zoomable clusters with establishment details
- Heatmap (no airports) — after removing the JFK anomaly
The original slide-based presentation is also preserved, because some things are worth keeping around.